Overview of Intelligence Testing
The Bell Curve
Intelligence tests, more commonly known as IQ tests, compare an individual's performance on a given task to the range of observed scores of same-age peers on the same task. This is known as norm-referencing - comparing one person's score to the scores of people within a sample population in the same age group. All norm-referenced psychoeducational tests use a normal distribution - the Bell Curve - to determine student scores.
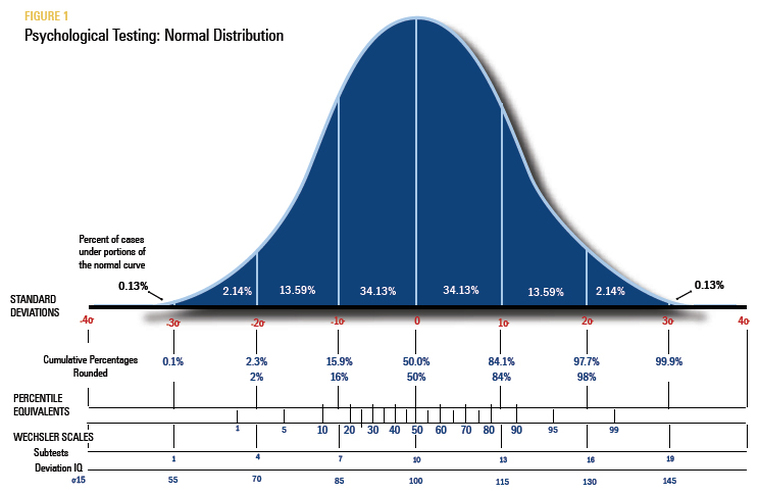
The normal distribution is based on the fact that most people's performance on a given task will be similar to one other and will fall within one standard deviation of the mean (average) score.
Within a general population, 68% of scores will fall within one standard deviation of a mean score. This is typically considered the Average range. Children who have a standard score below 85 or a T-score below 40 on a component of an IQ test are generally considered to be relatively weak in that area as compared to same-age peers.
Key Terms:
Percentile rank - the percentage of individuals within a given age group who performed the same or better than the student
Standard score - mean of 100 and standard deviation of 15
Scale score - mean of 10 and standard deviation of 3
T-score - mean of 50 and standard deviation of 10
